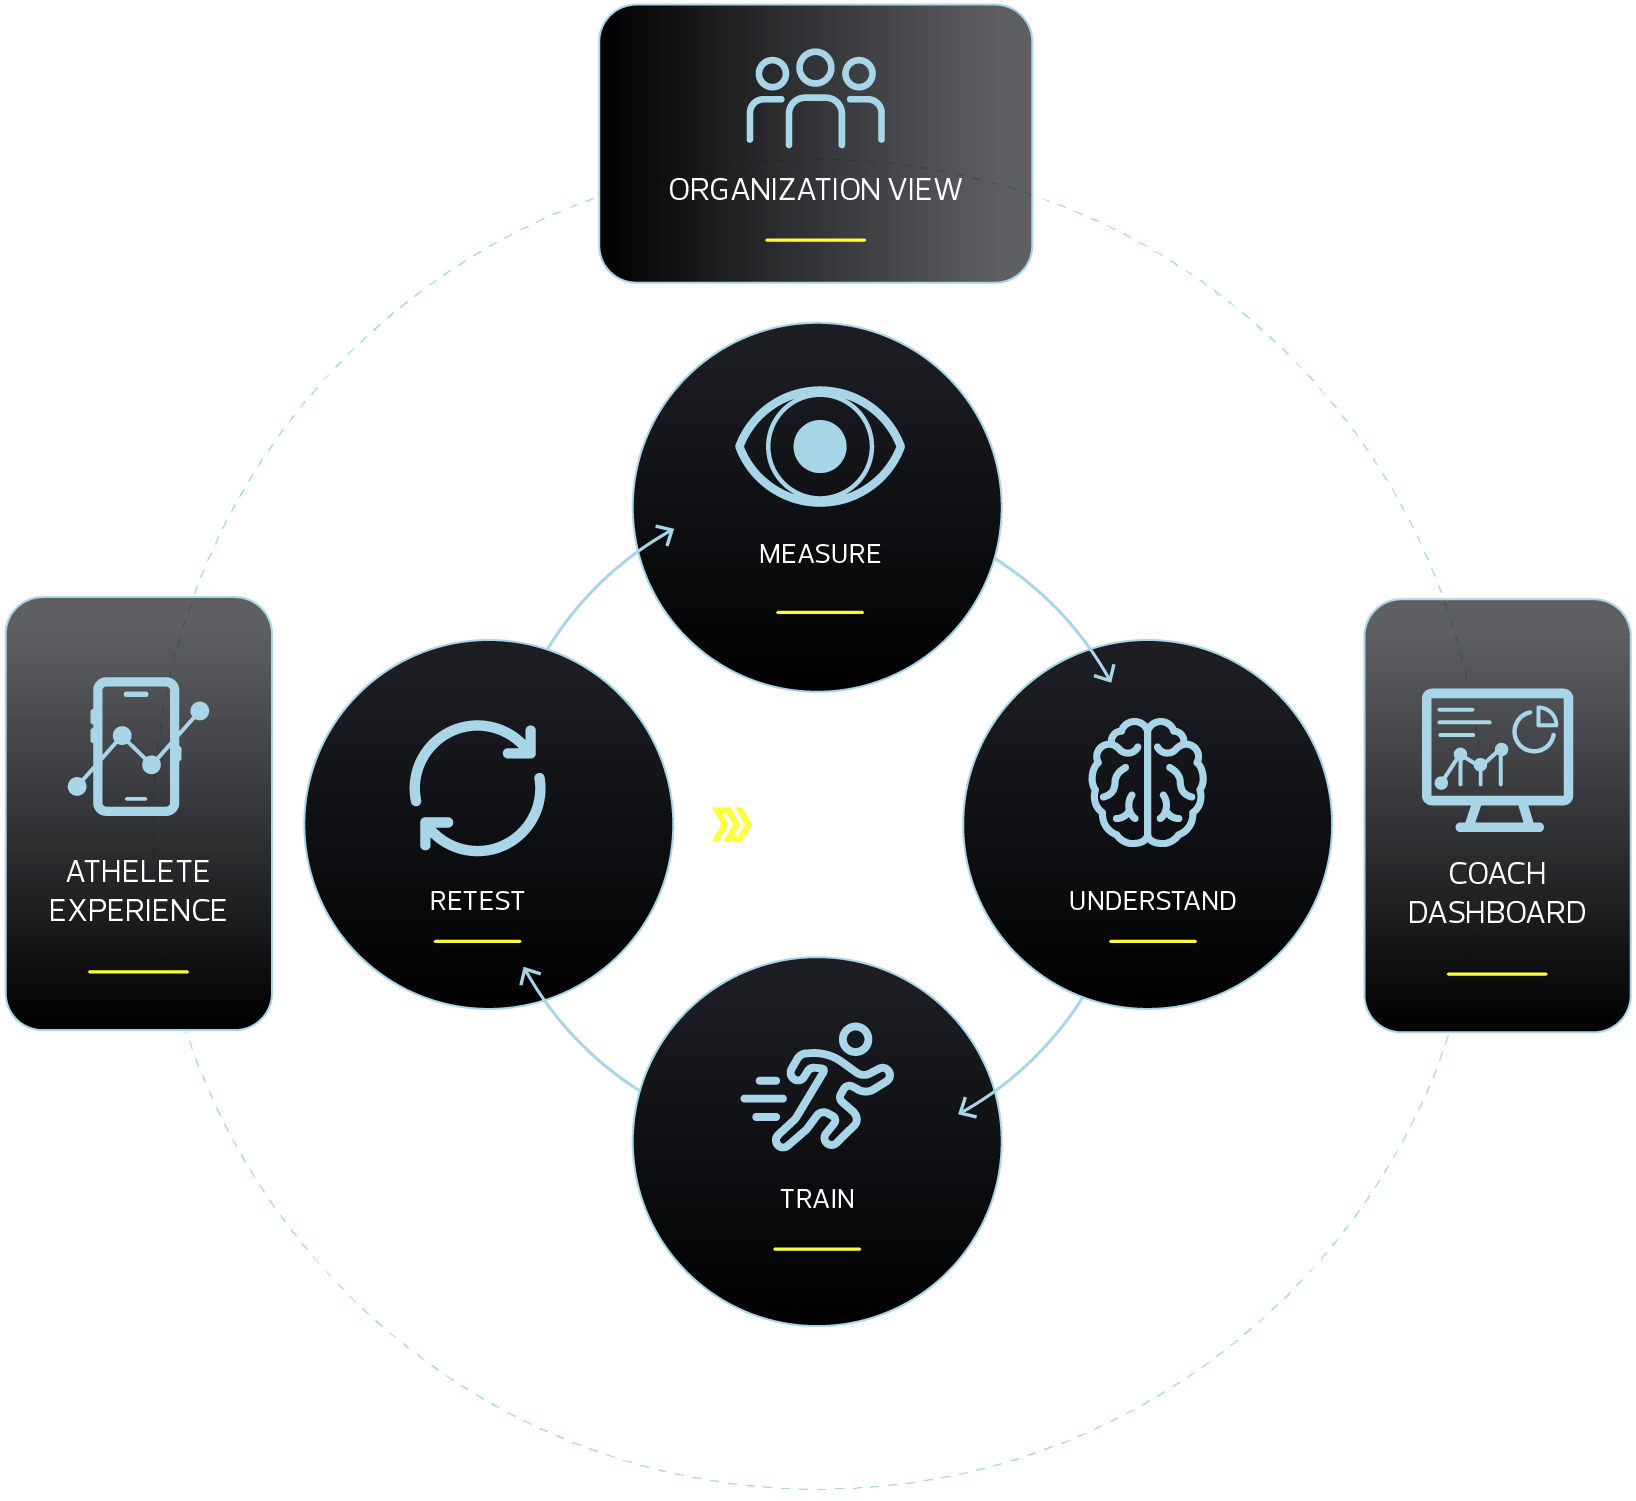
Flowchart diagram illustrating a cycle with main components: Organization View, Athlete Experience, Retest, Understand, Train, Coach Dashboard, and measure, connected with arrows. The diagram features icons representing each component, with labels inside circles and rectangles, and a central section labeled 'Measure'.

One connected platform for athlete development.

NeuroDrive connects objective assessment, performance insights, personalized training, and progress tracking in one continuous development system.

Athletes know what to work on. Coaches know where to focus. Organizations see development across every athlete and team.

Establish a clearer
starting point.

NeuroDrive assesses five connected systems of neuro-performance to establish an objective individual baseline.

Structured assessments reveal strengths and development priorities—creating the foundation for personalized training and progress tracking
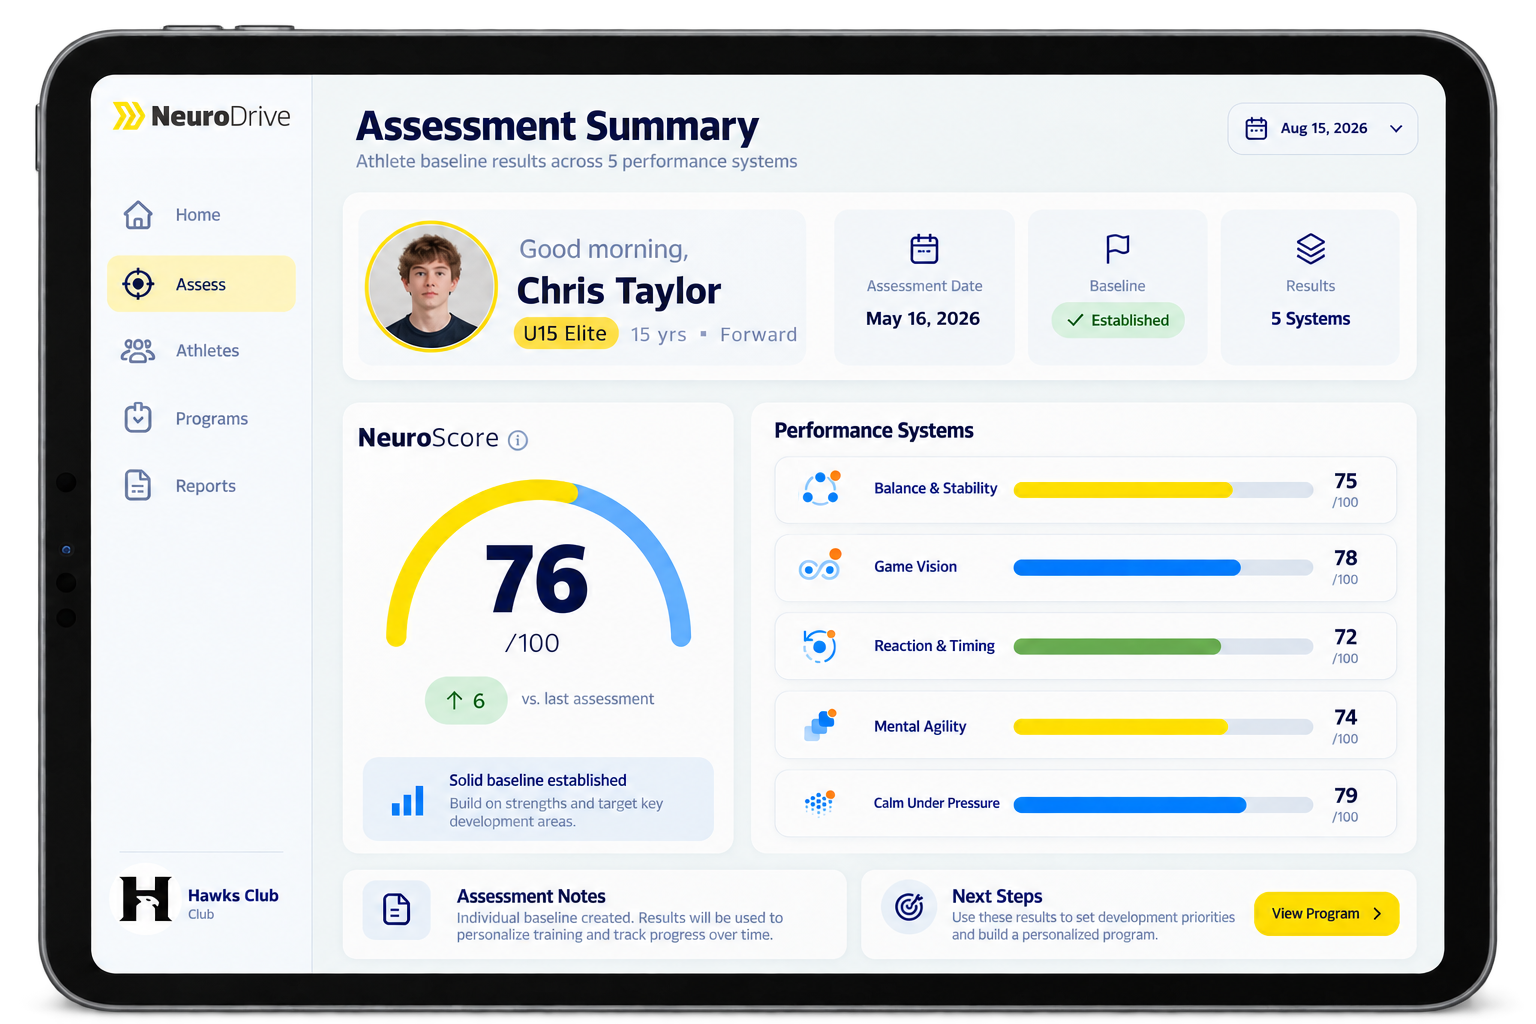
Assessment summary screen for a teenage athlete named Chris Taylor, displaying his NeuroScore of 76 out of 100, performance system results, and an option to view program details.
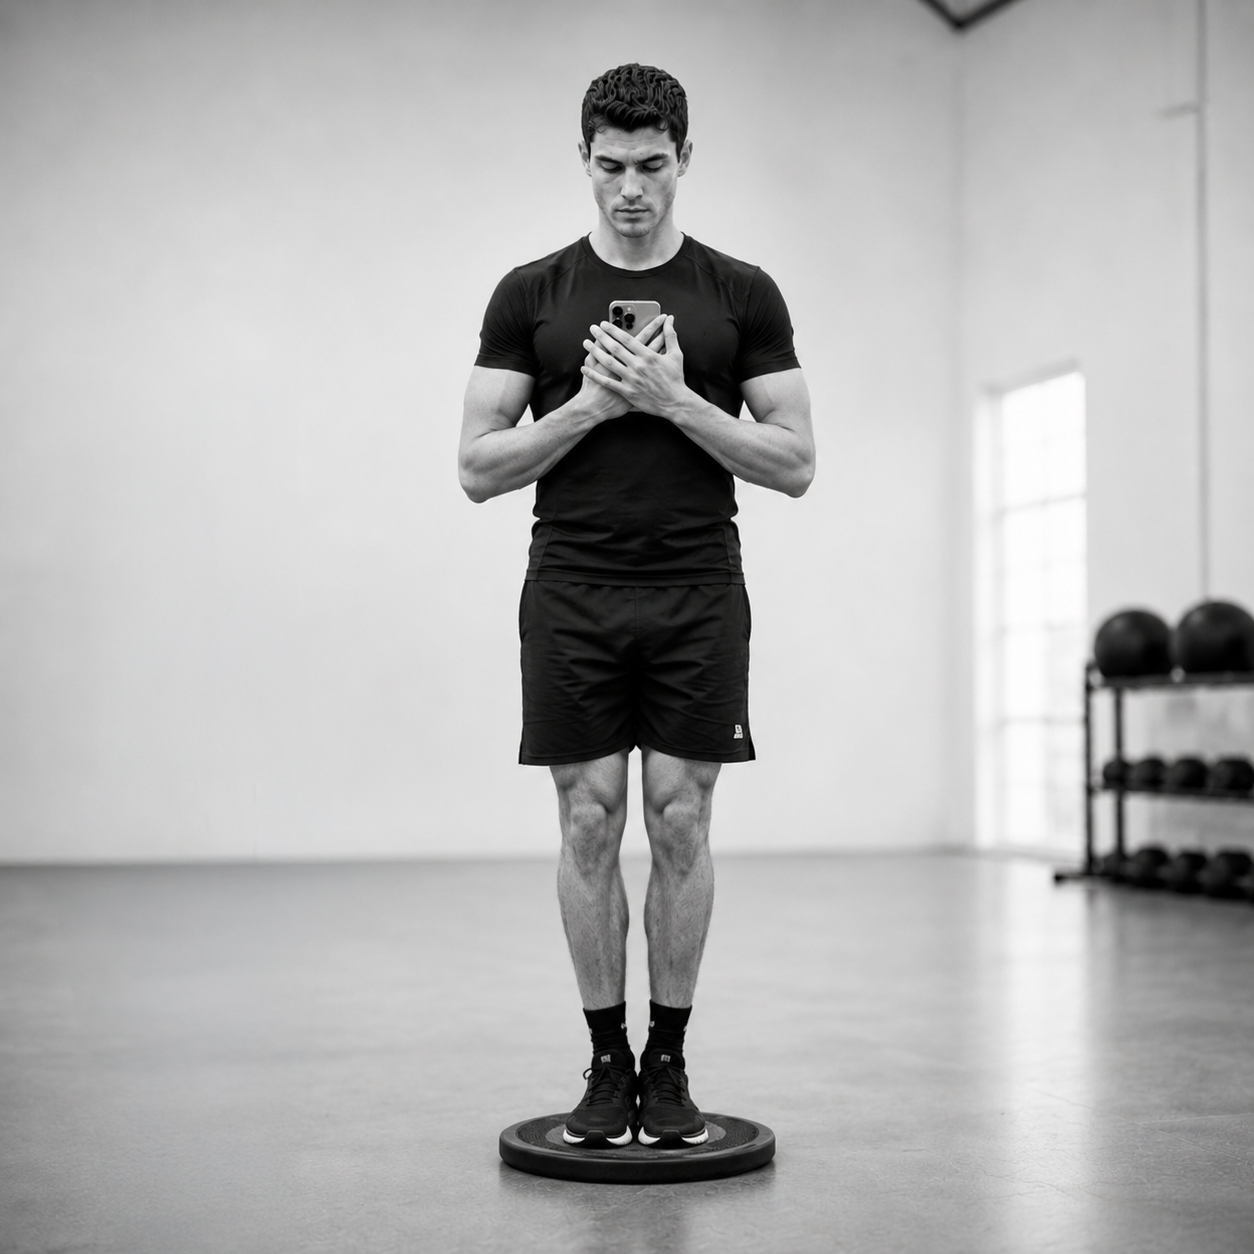
A young man in athletic clothing standing on a balance disc in a gym, looking at his phone.

Consistent Assessment
Standardized across athletes and teams

A black and gray crosshair target symbol with a central dot.
A diagram of a central circle with six lines extending outward, each ending in a smaller circle, resembling a molecular structure or network diagram.

Individual Baseline
A profile that can be compared over time

A simple black line graph with three points connected by lines, trending upward.

Turn results into
clear direction.

NeuroDrive translates assessment data into a NeuroScore, system-level results, and an individual performance profile.

Athletes and coaches can quickly see what stands out, where development should focus, and what to work on next.
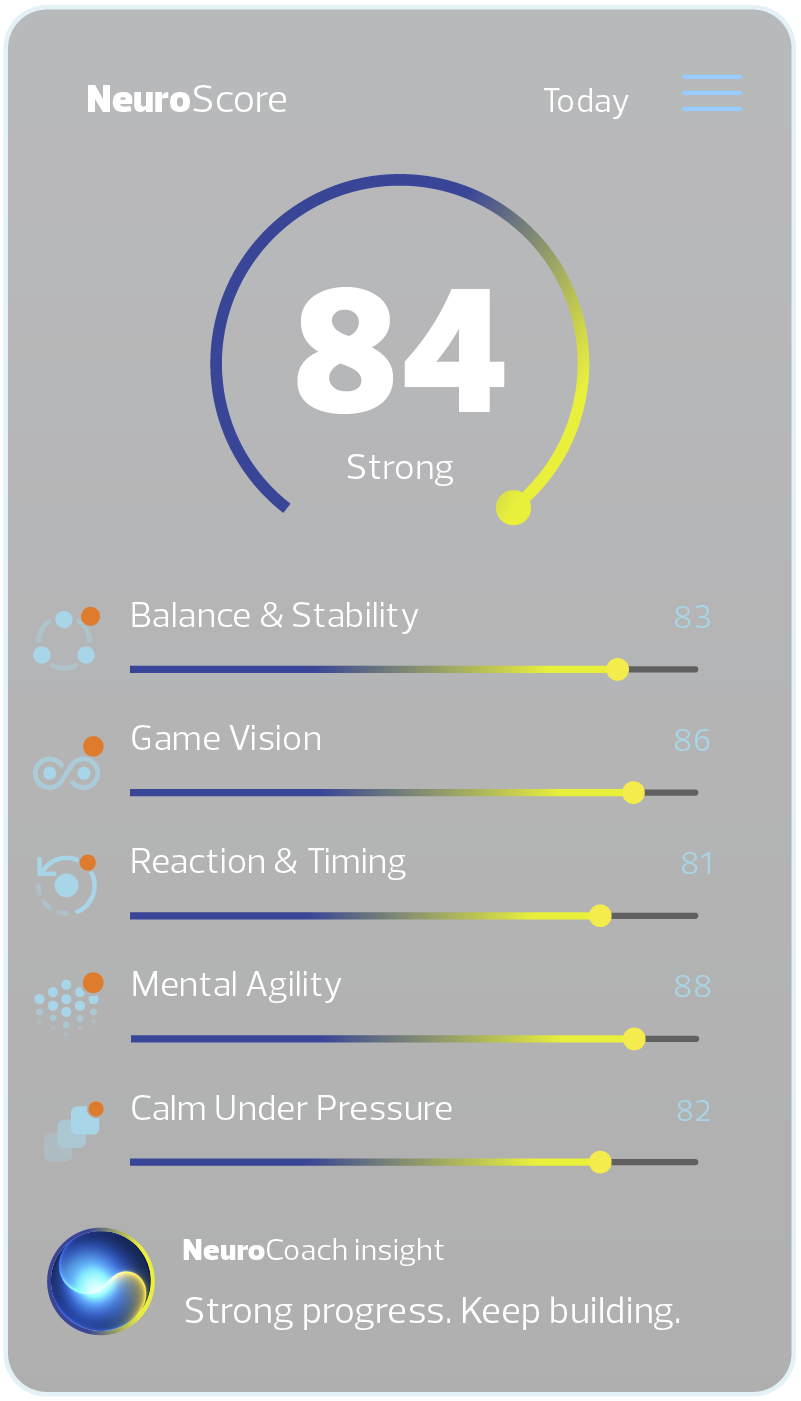
Mobile app screen displaying a neuro score of 84 labeled as strong, with individual metrics for balance and stability, game vision, reaction and timing, mental agility, and calm under pressure, along with a neuro coach insight message.

Turn insight into personalized training.

NeuroDrive turns each athlete’s results into training built around their individual development priorities.

Athletes receive a clear daily plan, understand what they’re working on, and see how each activity connects to their development.
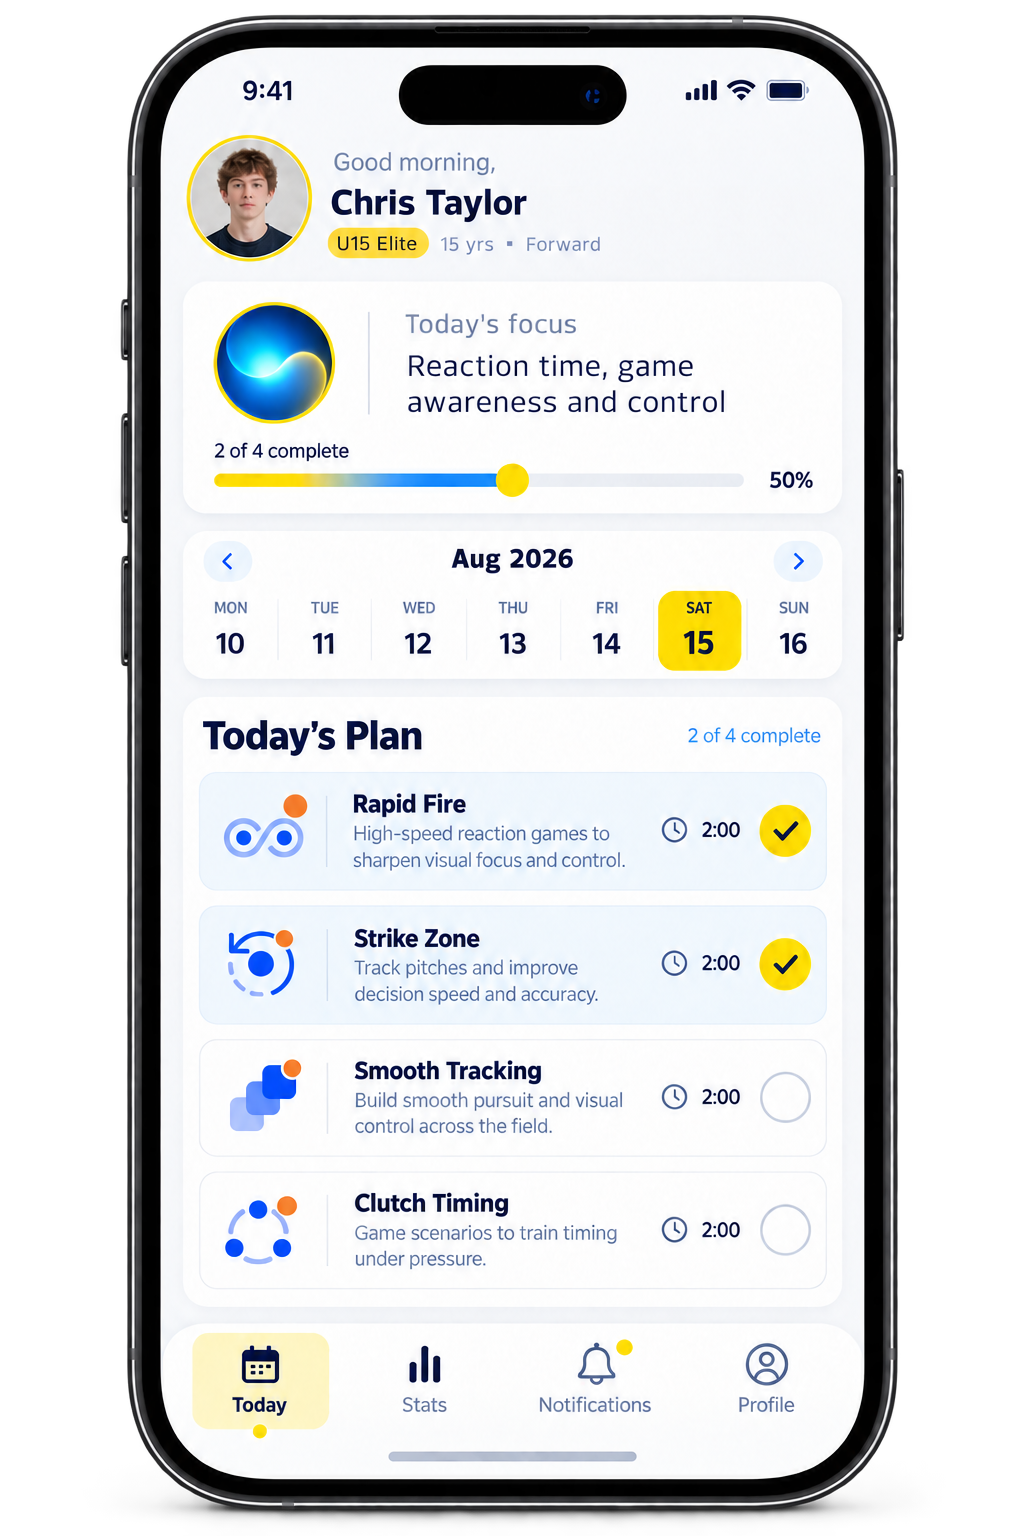

A smartphone screen displaying a sports training app with a profile picture of a young male, daily training focus on reaction time and game awareness, calendar with August 15 highlighted, and today's training plan including reaction games and drills.
Close-up of a yellow circle with a black outline on a white background

Yellow circle in the center with a black background and a blue ring surrounding it.

Black background with a yellow circle in the center


Yellow target or crosshair symbol on black background

Built Around Results
Training reflects each athlete’s assessment profile.


Icon of a yellow calendar with a football play diagram on it.

Personalized Daily Plan
Each athlete knows exactly what to work on next.

A yellow network diagram with a central circle connected to seven smaller circles on a black background.

Connected to Purpose
Every activity targets a defined development priority.
See how athletes develop over time.


NeuroDrive connects personalized training with consistent retesting, giving athletes and coaches an objective view of change over time.

Our analysis of results identifies what has changed and how the training plan should adapt.
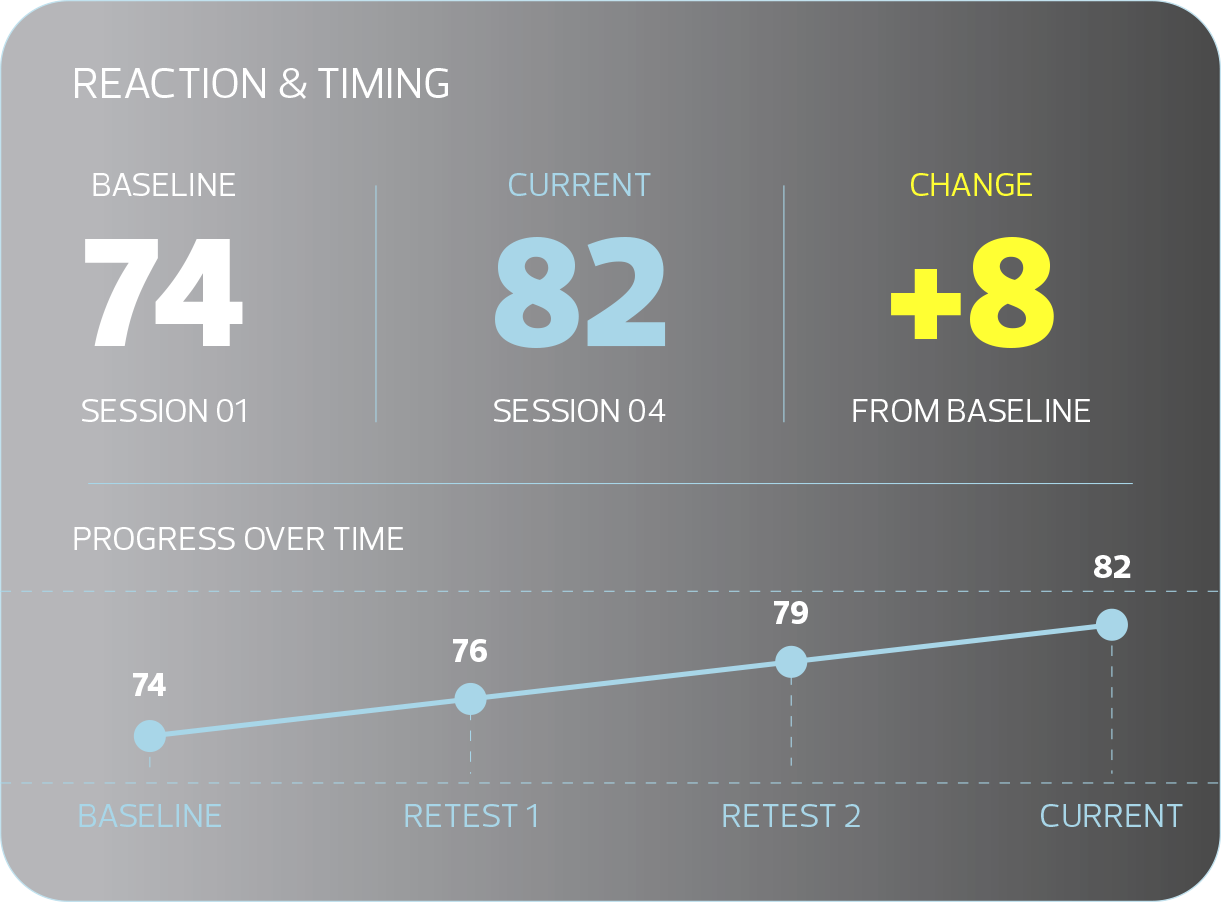
A dark-themed data visualization chart showing reaction and timing data, with baseline value 74, current value 82, and a change of +8 from the baseline. The chart includes a line graph tracking progress over time with points at 74, 76, 79, and 82.
Black circular badge with yellow border and the number one in the center.
Yellow number 2 inside a black circle outlined in yellow.
A black circular background with a yellow border and the number three in yellow in the center.

Consistent Retesting
Return to the same performance systems at defined intervals.

Track Change
Compare current results with the athlete’s previous baseline.

Adapt the Plan
Update development priorities and personalized training as results change.

Put athlete insights within reach.


The Coach Dashboard brings athlete profiles, development priorities, training activity, and progress together in one place—giving coaches objective insights to complement what they see in practice and competition.
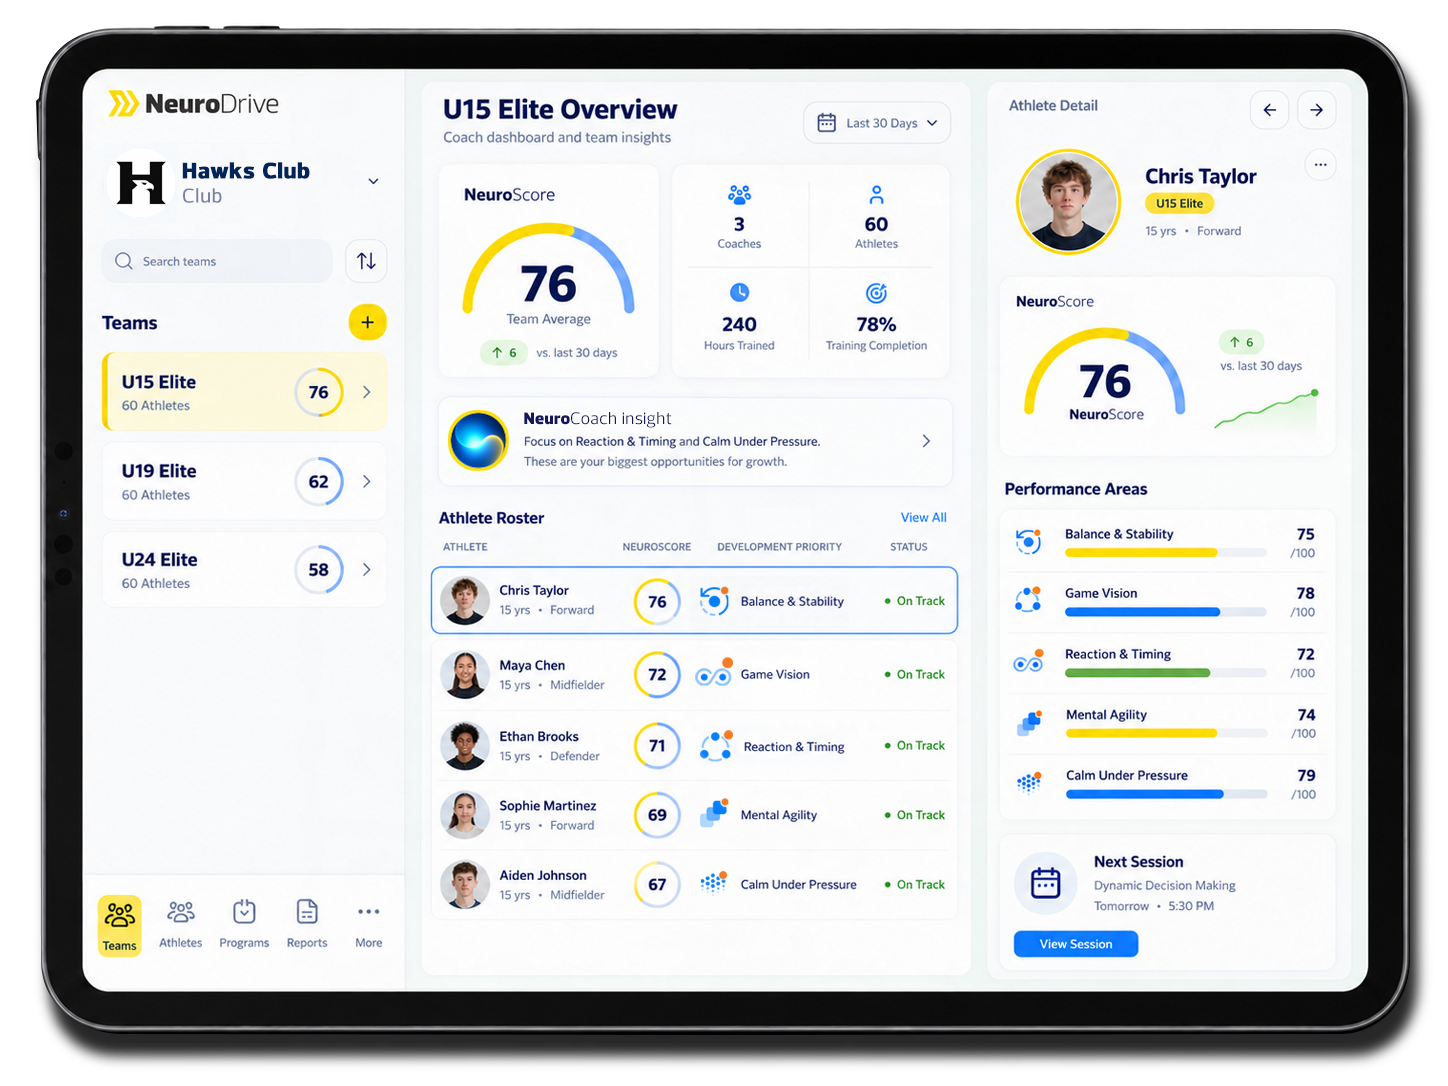
Digital dashboard for U15 Elite basketball team showing coach insights, player stats, and performance metrics, with team and player details.
Yellow target icon on a black background.
Yellow tic-tac-toe board with X and O symbols on a black background.

Understand the Athlete
See strengths, results, and development priorities.

Yellow line chart with upward trend on a black background.

Monitor the Plan
See what each athlete is working on and how consistently they are training.

Track Development
Follow training activity, progress, and retesting over time.


See every athlete.
Understand every team.

Bring individual results, team-level patterns, development priorities, and progress together in one connected view across your organization.
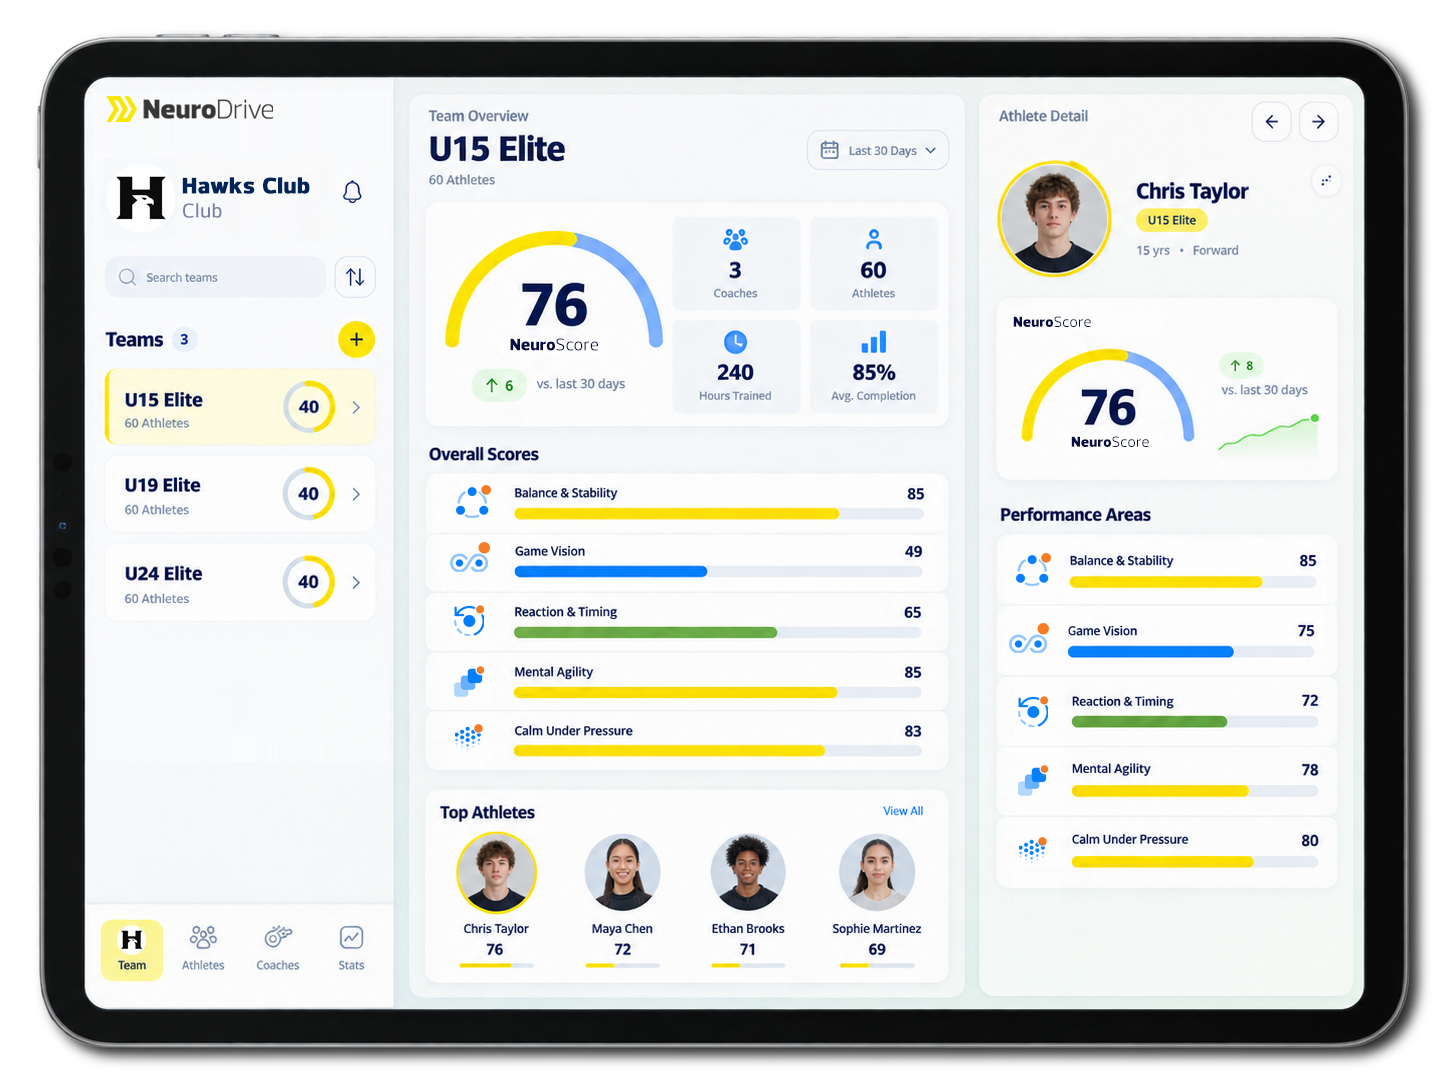
Team overview dashboard for U15 Elite Hawks Club basketball team showing player Chris Taylor's profile, overall neuroscoring and stats, top athletes, and performance areas.
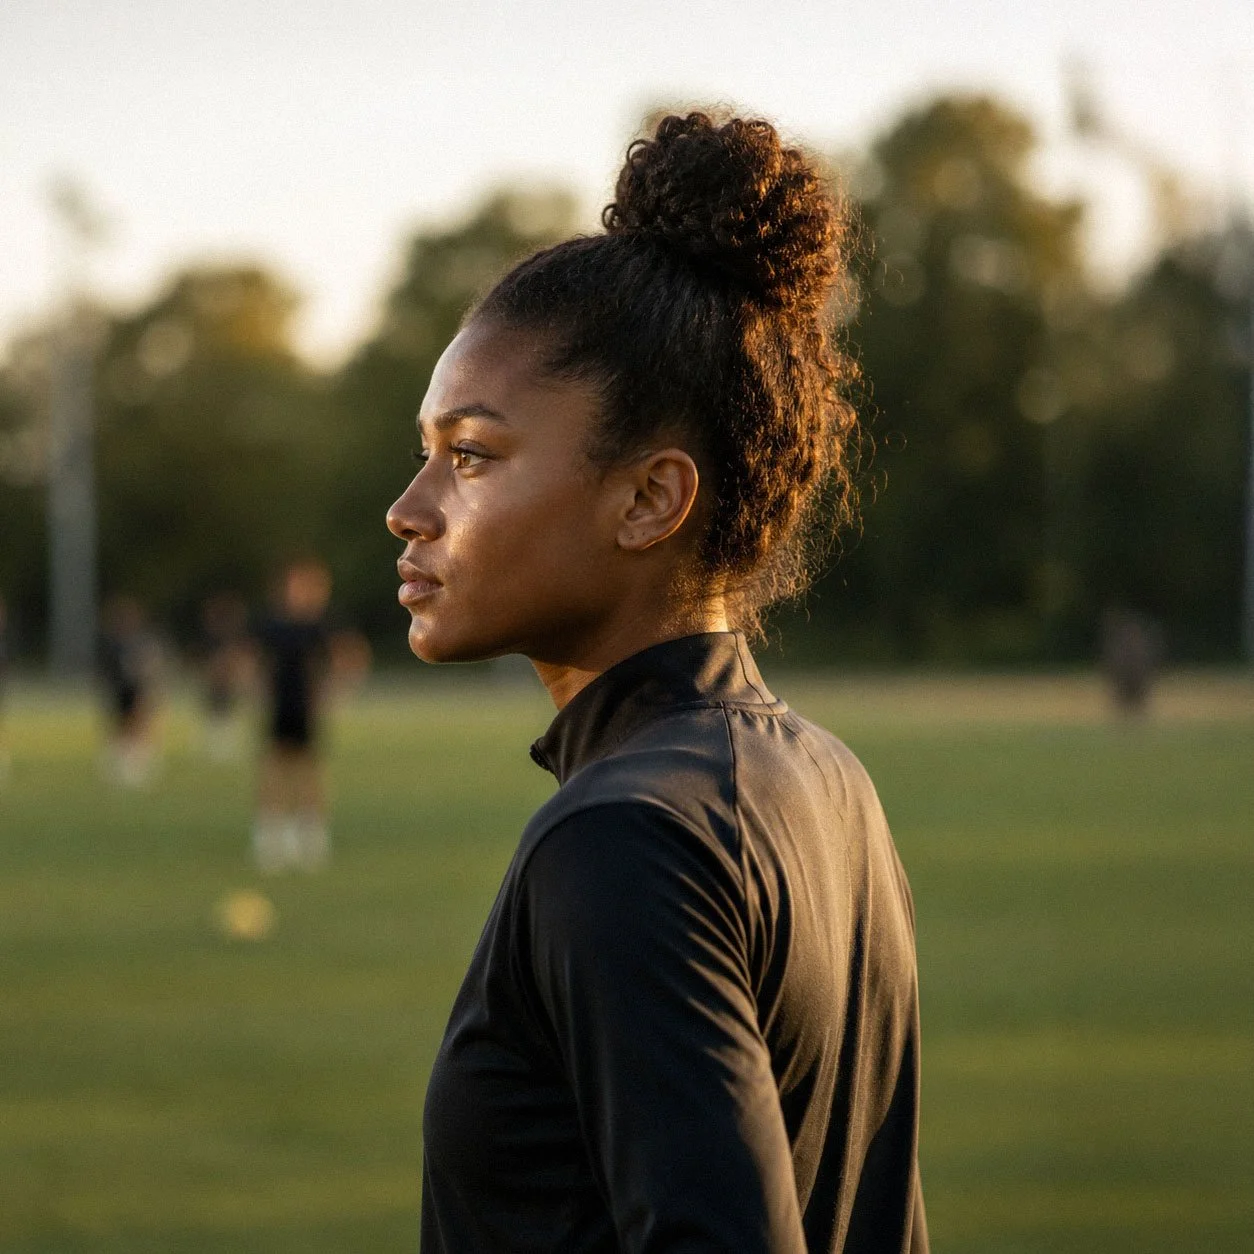
Profile of a young African American woman with curly hair tied up in a bun, standing outdoors on a field during sunset.

Individual Visibility
Understand each athlete’s profile and priorities.
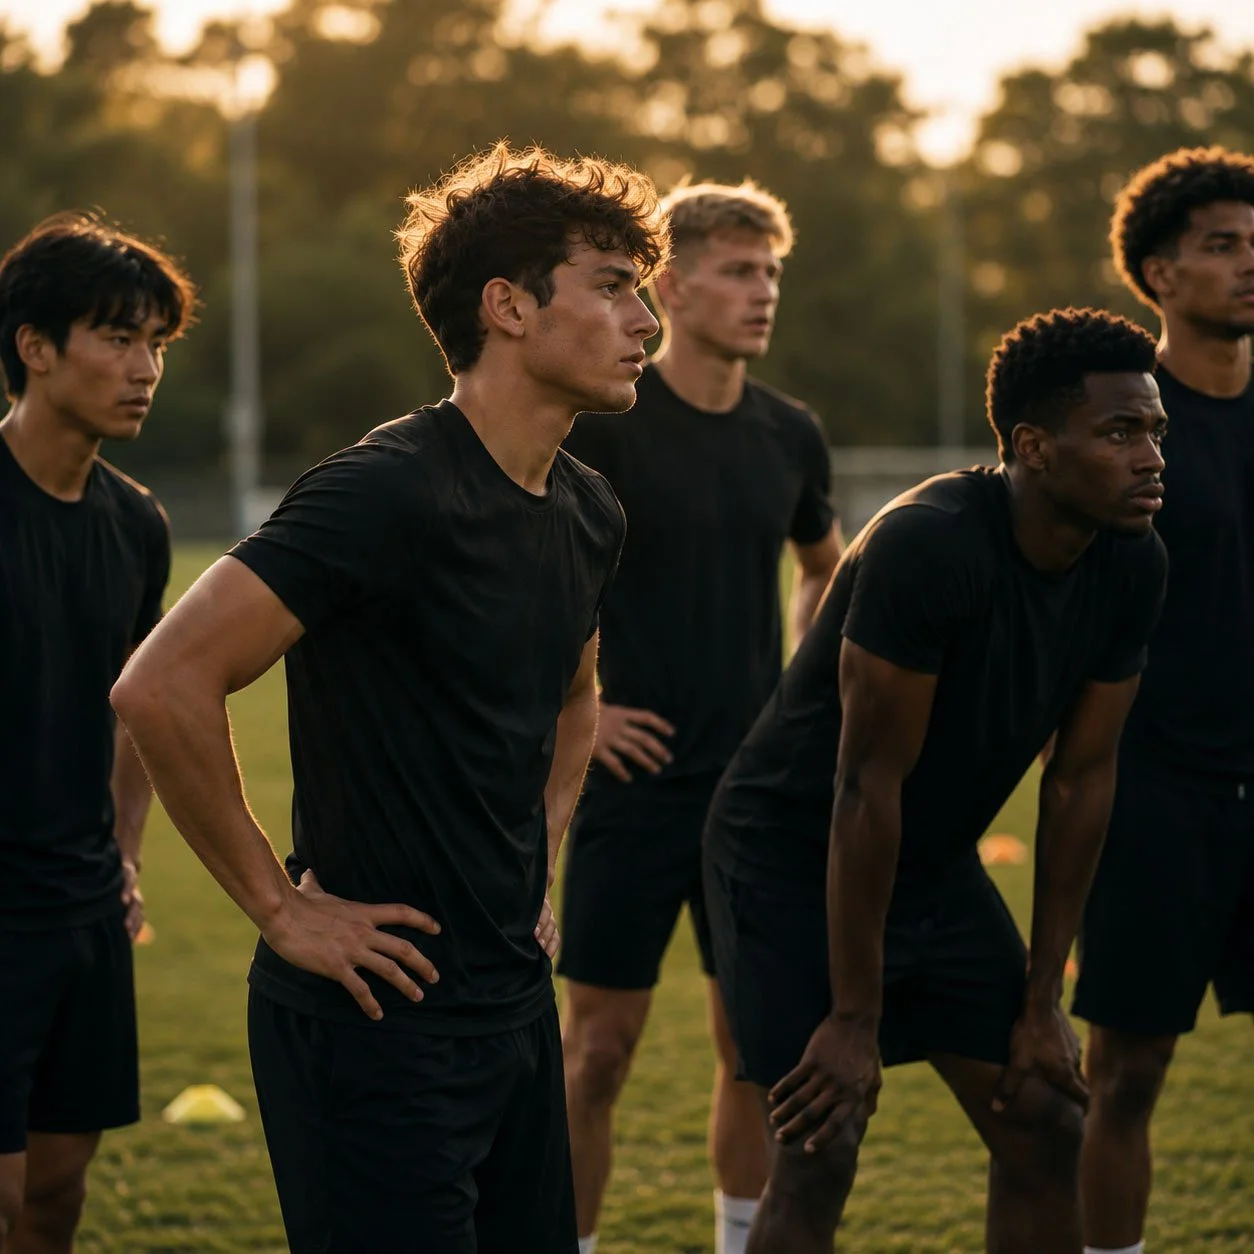
Group of male soccer players in black uniforms standing on a field during sunset, focusing on the game.

Team-Level Insight
Identify patterns across athletes, teams, and age groups.
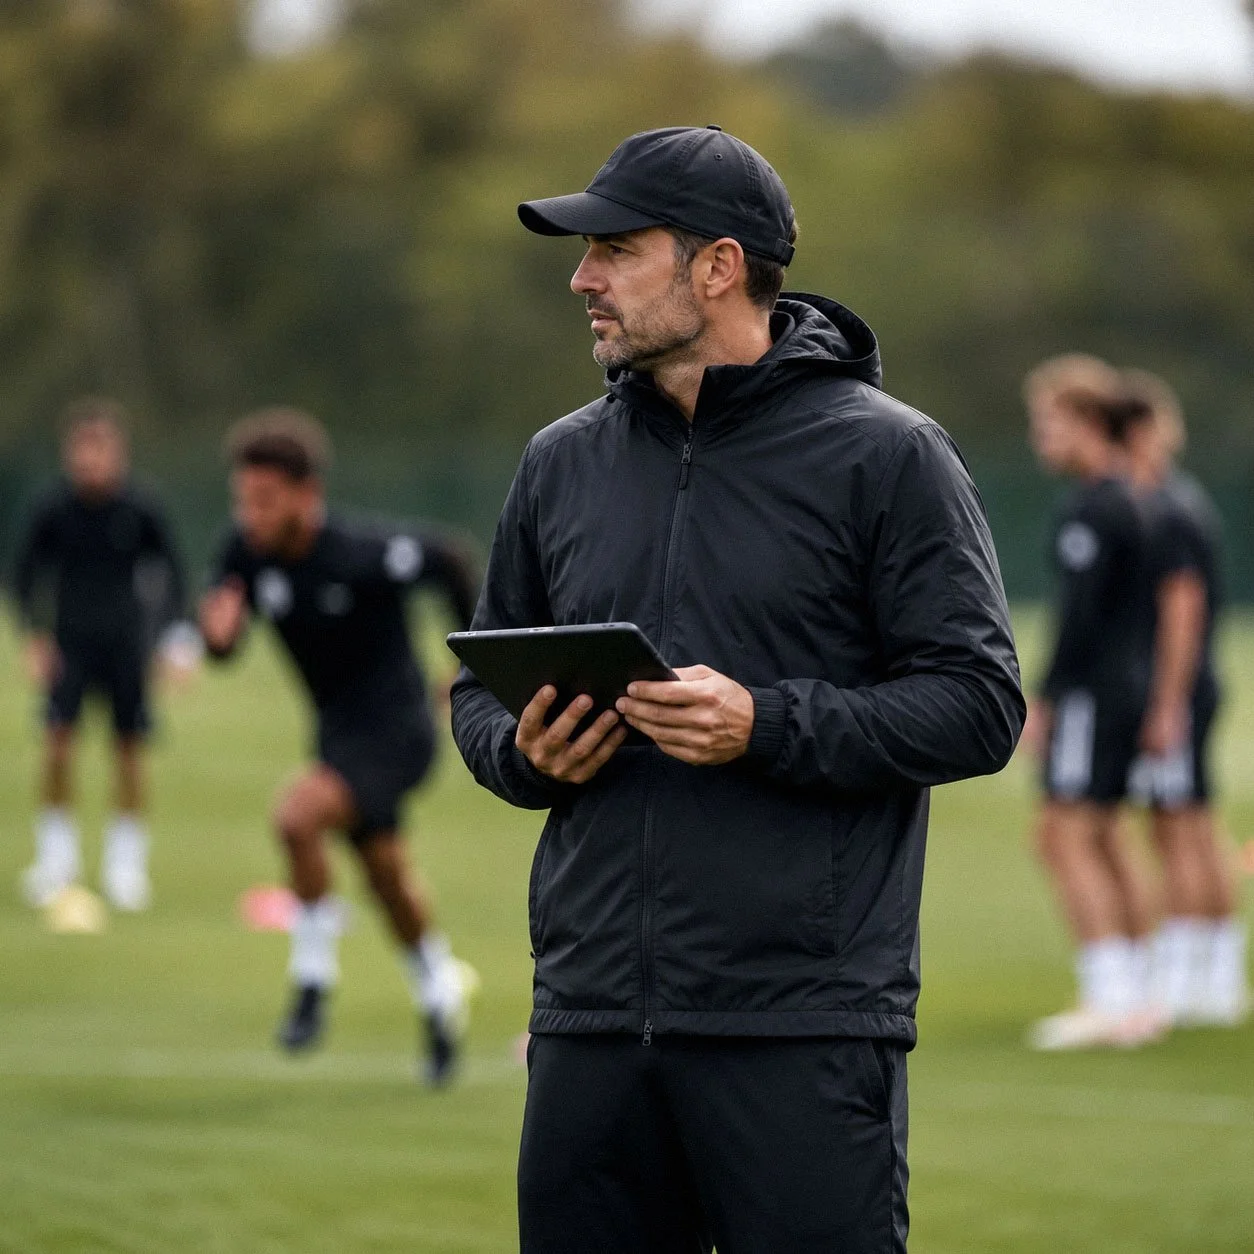
A man in a black jacket and cap holding a tablet on a grassy field, with a soccer coach and players in uniforms blurred in the background.

Development at Scale
Create a consistent approach to neuro-performance across your organization.


A young male soccer player sitting on the sidelines of a field, watching a game during sunset with his teammates in the background.
Diagram illustrating a sports performance improvement process with key components: organization view at the top, measure at the center, training below, understand to the right, retest to the left, athlete experience on the left, coach dashboard on the right, and arrows showing the flow between these elements.

See NeuroDrive
in action.


See how assessment, personalized training, coach insights, and progress tracking come together across your organization.

Assessment summary page on a tablet screen showing athlete's performance results, profile, and various metrics.
Mobile app screen displaying a daily training plan with sections for focus, calendar, and today's activities, including reaction games and decision-making exercises.